There are several metrics describing your ad performance. Refer to Basics of SEA to recall the definitions of the various important KPIs. In this section, we distinguish between Basic and Advanced Performance Metrics.
Basic Performance Metrics
Market Metrics
Market metrics are values emerging from the market of paid search. They reflect the cost-side of SEA and can be directly influenced by advertisers. The table below contains all market metrics and gives exemplary values.
| Prefix | Avg_position | Impressions | Clicks | Orders | Costs | CTR | CR | CPC | CPO |
| N | N | N | N | € | % | % | € | € | |
| category | 3,53 | 79.154.029 | 710.827 | 3.404 | 265.862 | 0,90% | 0,48% | 0,37 | 78 |
| brand | 2,71 | 7.122.741 | 114.660 | 590 | 32.893 | 1,61% | 0,51% | 0,29 | 55 |
| color | 2,53 | 6.512.080 | 55.741 | 278 | 20.207 | 0,86% | 0,50% | 0,36 | 72 |
Table 1. Market metrics examples
Business Metrics
On the other side business metrics reflect the revenue-side of SEA. Advertisers only have limited influence to change them. The metrics are strongly tied to the business performance and the portfolio of products. During an economic crisis, for example, the market for luxury products may not be influenced while the market for other goods shrinks significantly. The table below is an example of business metrics.
| Prefix | Revenues | Commission | RPO | RPC |
| € | € | € | € | |
| category | 867.772 | 280.711 | 254 | 1,22 |
| brand | 162.695 | 52.627 | 275 | 1,42 |
| color | 63.596 | 20.585 | 228 | 1,14 |
Table 2. Business metrics examples
Investment Metrics
Investment metrics are synthetic indexes for the effectiveness of the marketing investment on search engines.
| Prefix | ROI | CRR |
| % | € | |
| Category | 226% | 0,31 |
| Brand | 394% | 0,20 |
| Color | 214% | 0,32 |
Table 3. Investment metrics examples
Advanced Performance Metrics
Simple Scoring Models
In real business situations, we are given huge data sets with thousands of entries, where not all of them are relevant. Therefore, we need to shrink the data to the most relevant variables and focus on smaller groups of important data. For example, assume we have four keywords.
| Keyword | Clicks |
| KW 1 | 35 |
| KW 2 | 150 |
| KW 3 | 5 |
| KW 4 | 10 |
| Total | 200 |
Table 4. Four keywords example
In order to analyze keywords performance, we cluster data through ABC/Pareto analysis. Pareto analysis is a rule of thumb in decision making that states that 80% of the outcome is generated by 20% of the resources. In the context of keywords, the Pareto principle could apply.
Analogously, ABC analysis is a categorization technique that distinguishes between three categories, e.g.:
- “A” keywords are 20% of the keywords, which generate 80% of the revenues.
- “B” keywords are 30% of the keywords, which generate 15% of the revenues.
- “C” keywords are 50% of the keywords, which generate 5% of the revenues.
As a first step, we sort our keywords by clicks in descending order.
| Keyword | Clicks |
| KW 2 | 150 |
| KW 1 | 35 |
| KW 4 | 10 |
| KW 3 | 5 |
| Total | 200 |
Table 5. Outcome of sorting keywords in descending order
Then we calculate each keywords contribution to the total amount of clicks and assign them ranks like “A”,”B” or ”C”.
| Keyword | Clicks | Contribution to the total | Cluster |
| KW 2 | 150 | 75 % | A |
| KW 1 | 35 | 17,5 % | B |
| KW 4 | 10 | 5 % | C |
| KW 3 | 5 | 2,5 % | C |
| Total | 200 | 100% |
Table 6. Outcome of keywords clustering
This basic example could be extended to the real data in reports.
In a keyword report, we display a specific performance metric (e.g. revenues) in descending order. We then identify two thresholds (T1 and T2), and assign a cluster score (i.e., “A”, “B” or “C”) to each keyword, as shown in the graph below. The thresholds have to be defined under certain assumptions that must make sense in the underlying business model and dataset. There is no universal rule. The corresponding data always has to be considered.
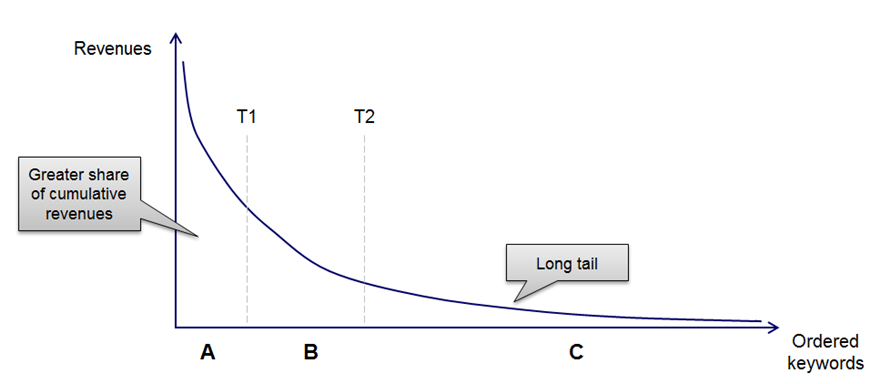
Figure 1. ABC Analysis (deltamethod academy, 2013)
“A” keywords are the most important keywords we have, since they generate almost 80% of the revenue. Therefore, we should prioritize improving their performance. “B” and “C” keywords should be seen as less important.
Dynamic Scoring Models
In order to speed up our analysis, we use dynamic scoring models that add some complexity. For example, dynamic scoring models make it possible to compare metrics within or between groups.
Assume we have an account with:
- One campaign
- Two ad groups
- Three ads for each ad group and their respective CTRs
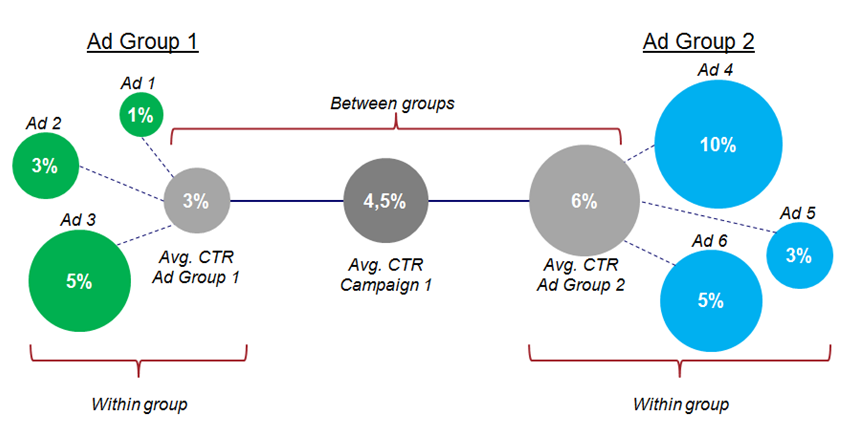
Figure 2. Dynamic Scoring Model (deltamethod Academy, 2013)
To assess each ad’s performance, it makes sense to calculate the average CTR for every Ad Group and for the campaign as a whole. Then we can compare each ad’s performance to the averages, and evaluate it. In the following example, the focus is on ads 1, 2, and 4.
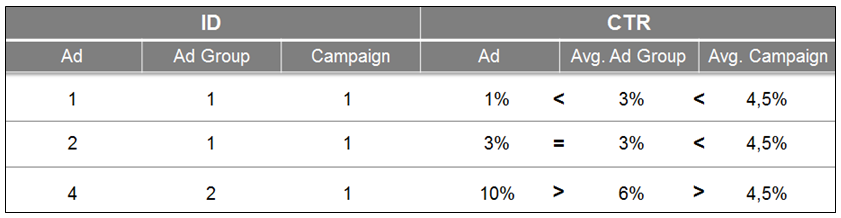
It is obvious that ad 1 is an underperforming ad. Ad 2 is matching the Ad Group average, but is underperforming between groups. Ad 4 is an outstanding ad, because it outperforms on each level.
Use a 60/40 balance between long tail and short tail keywords. Long tail keywords are very specific and users looking for something very specific show a higher willingness of purchase. Moreover, there is less competition on long tail keywords, so these keywords are often characterized by a low CPC.
– Erik Slenderbroek, Associate Account Consultant